
- 04/10/2017
- Posted by: Millon Unika
- Category: All, Graphics, Technology, Web Design, Web Development

Top Open Source JavaScript Data Chart Libraries for Developers
For any web project frontend development is one of the most crucial part today. With every advance version launch of JavaScript libraries, plugins & frameworks Frontend look & feel going higher. You need to have a moderate knowledge of JavaScript if you want to implement its different elements into your frontend development & beautification. JavaScript Data Chart Libraries are kind of JS element which help developers to render & represent their data set into HTML pages with a high value graphical chart, animation & different styles of visual presentation. Here we will discuss about Top Open Source JavaScript Data Chart Libraries for Developers.
You may like: Top Android Studio Plugins for Android App Development
Chart.js
Chart.js is one of the most popular open source JavaScript data chart libraries among the developers. This JS library is widely used for data rendering, generating any type of data charts, data graphs or any visual presentation of data element.
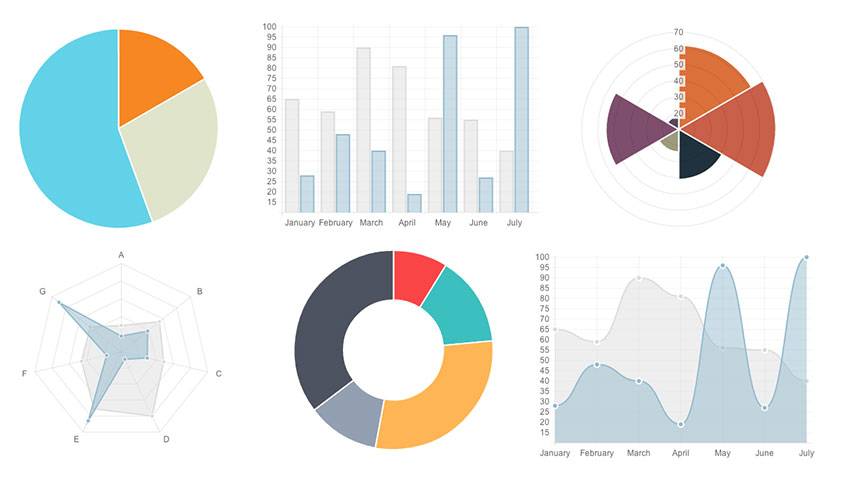
With Chart.js we can render any data using HTML5. Moreover we can create dynamic effects here using canvas elements. We can generate Data Graphs & render Data on a HTML5 canvas with dynamic visual chat & also can implement hover tooltips and click events to get more information about chart data. This open source effective & powerful data chart library can generate bar charts, line charts, pie charts, radar charts etc. and also other advanced graphical styles with data.
Most importantly this library is fully responsive and compatible with all modern browsers. Its render data chart is well visible in almost all current browsers.
jqPlot
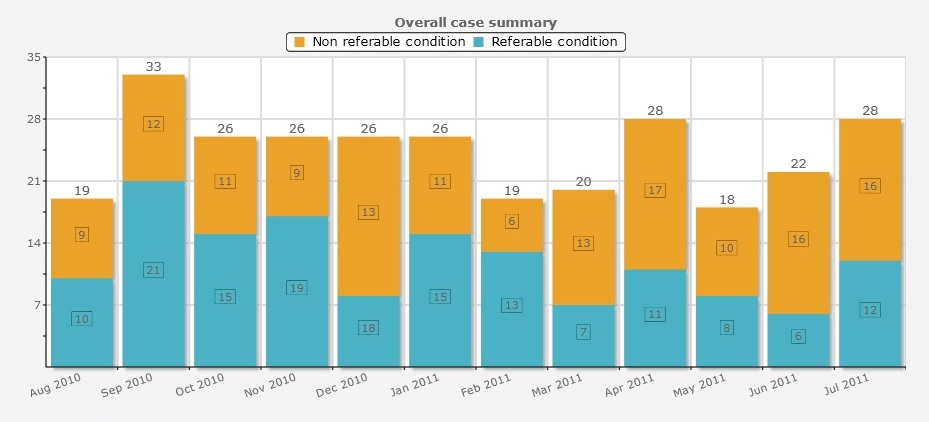
jqPlot is another effective & popular dynamic data chart library. Its open source & widely accepted for its ease of use. It renders data as static images and embeds those dynamically. Its highly useful & fast because you can update chart data using Ajax and moreover you don’t even need to refresh the page for update the chart. You can also implement hover tooltips for more data information with some of its chart styles.
For its fast & data update feature its very handy for complex data sets.
Chartist.js
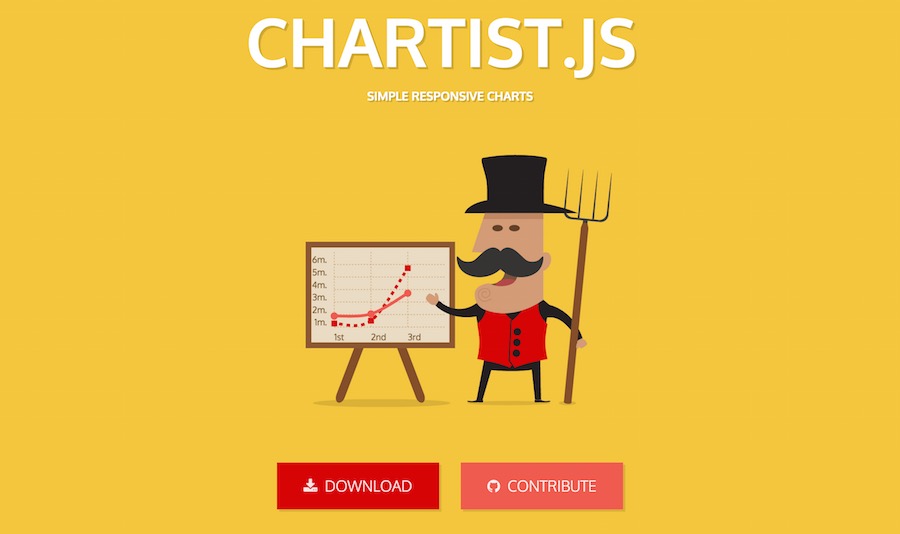
Chartist.js is another open source JavaScript data chart library holds the third place in the top list. This is also very popular among the developers for its easy interface, navigation & implementation. Most importantly this chart library is easy to customize.
This is a fully responsive & dynamic data chart library. Its chart styles are highly customizable in terms of sizes & color schemes. Chartist.js depends on SVG to render data graphs into images. It then represents those images dynamically.
It also has a great feature for data animation. Its charts & data animation goes perfect with all the modern browsers. Only some older browser versions can face some problem while loading it.
HighChartTable
HighChartTable is another free open source data chart library. This is basically a plugin which transforms table data into graphical charts.
It’s a jQuery plugin, thus easy to implement with data sets & has a smart look & feel.
xCharts
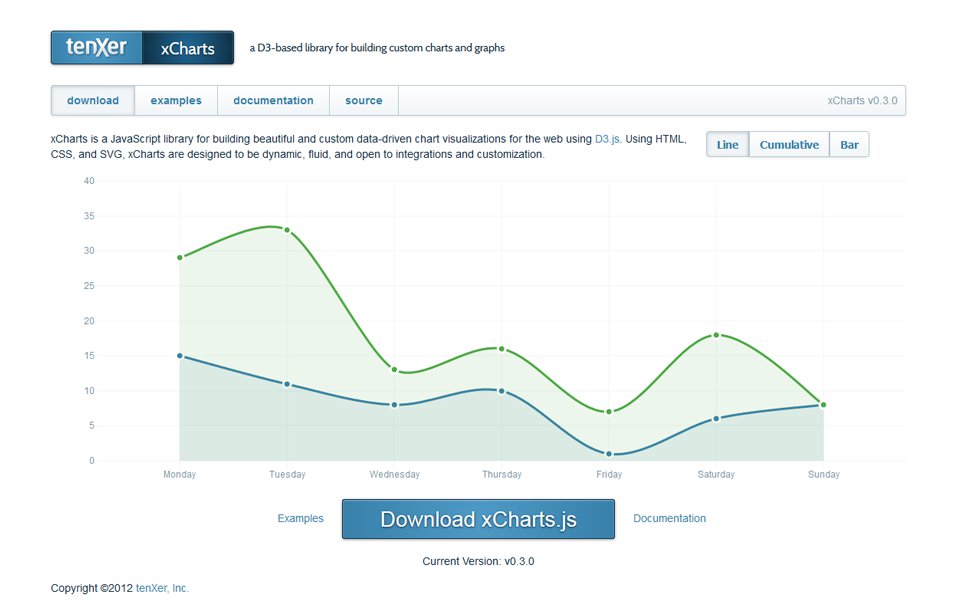
xCharts is another open source popular JS data chart library which is highly popular among advance developers who implement complex data sets & high end data visualization. This is also an advance plugin based on D3.js library. It’s effective to render data into charts & other graphical visualization dynamically.
You can easily adapt & customize xCharts’ render data & chart styles. Also you can easily add or remove animations & functions while rendering.
C3.js
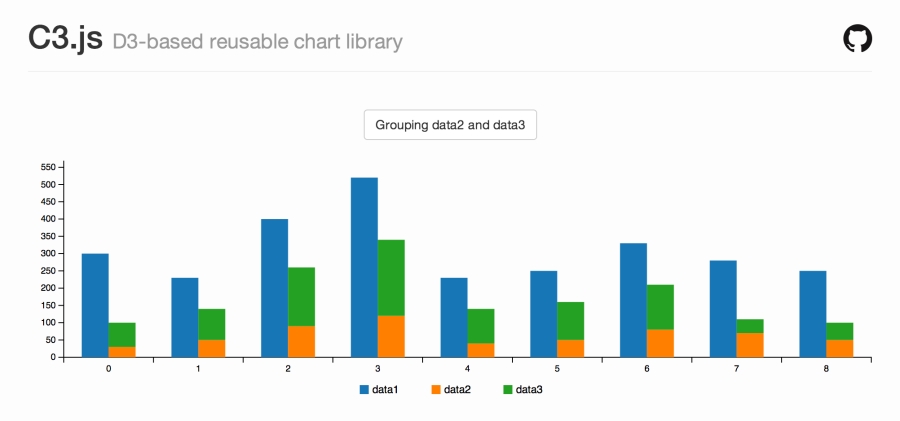
C3.js is also an open source data chart library based on D3.js library. The main purpose of C3.js library is to render data charts & provide a visual representation of the data set into a HTML page simply & seamlessly. You don’t need to write down custom & complex chart codes to implement data representation.
Moreover it’s highly customizable in terms of size, colors & styles. Also you can implement hover tooltips & onclick function into it. The best part is that the documentation is compact & structured, therefore it’s easy to nail & implement for a JavaScript Developer.
Pizza Pie Charts

Pizza Pie Charts is a renowned open source JavaScript data chart library by ZURB, a reputed frontend design company. This is basically a JS library for rendering data sets into SVG based pie charts.
The best part is that you can modify & customize its various features & display settings directly in CSS or JavaScript. Zurb is a reputed company working with large expert team mainly in the frontend development sector. Therefore it’s very obvious that this is a very powerful & high quality library. This is mainly for rendering data set into pie chart, so it’s better to use this library if you want a good pie chart representation and for other styles better go for other libraries.
You may like: Top Android Libraries for Android App Developers