
- 24/04/2017
- Posted by: Millon Unika
- Category: Infographics, Internet, Smartphones, Technology
What People Do with their Smartphone – Trends and Statistics [Infographic]
Our Daily Activities Through Smartphone has a massive range altogether. Smartphone is now an integral part of our daily lifestyle. Starting from shopping to social engagement; almost every thing is driven by a smartphone now a days. Lets have a look what people generally do with their Smartphones.
![What People Do with there Smartphone Trends and Statistics [Infographic]](https://www.unikainfocom.in/file/2017/04/What-People-Do-with-there-Smartphone.jpg "What People Do with there Smartphone Trends and Statistics [Infographic]")
Smartphone Usage Percentage For Various Categories :
| Games | 64% |
| Weather | 60% |
| Social Networking | 56% |
| Maps / Navigation Search | 51% |
| Music | 44% |
| News | 39% |
| Entertainment | 34% |
| Banking & Finance | 32% |
In the first place we will see how addictive a smartphone can be for a user.
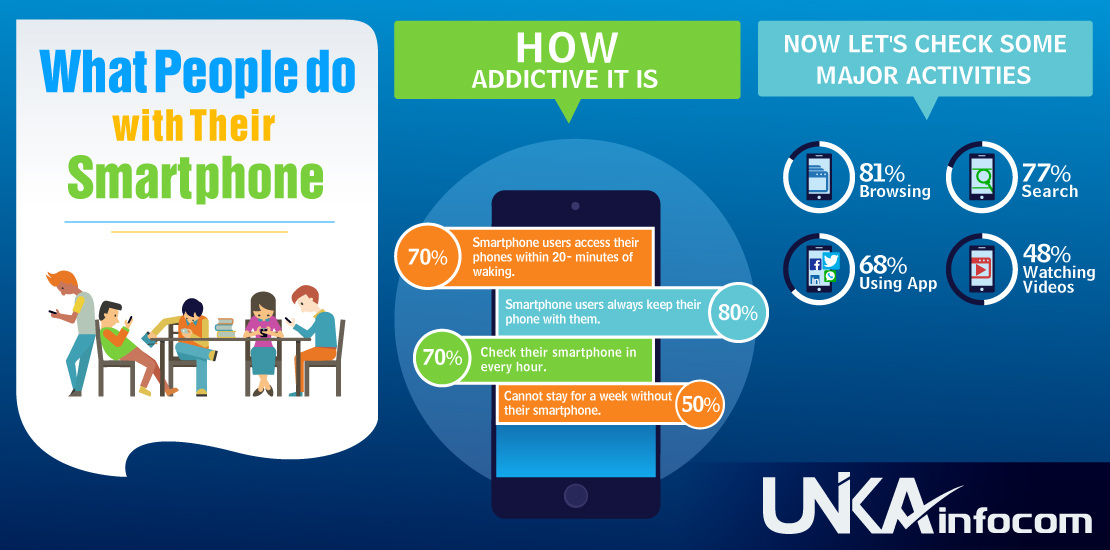
How Addictive it is:
70% of Smartphone users access their phones within 20 minutes of waking.
80% of Smartphone users always keep their phone with them.
70% check their smartphone in every hour.
50% can not stay for a week without their smartphone.
Now Let’s Check Some Major Activities:
Browsing: 81%
Search : 77%
Using App: 68%
Watching Videos : 48%
Smartphone For Shopping:
In general 80% of user help their shopping with their smartphone.
70% of the consumers use Smartphone for shopping.
54% uses smartphone for finding store
49% uses it for price comparison.
48% use it for coupons, offers & deals.
44% use it for verifying product review.
74% make purchases through smartphone searches.
Smartphone Usage for Information:
In general 77% of smartphone users do various info. searches with smartphone.
95% always look for local info. searches.
88% uses for instant information seeking for taking decision or action.
78% search for business information & contact.
Contact us today Mobile App Development | Website Design