
- 06/06/2017
- Posted by: Millon Unika
- Category: All, Business, Infographics
Revenue Facts & Ranking of Top 10 Software Development Companies-Infographics
Here we are going to discuss about interesting economical facts about some of the world’s biggest Software Companies. Let us have a look into Revenue Facts & Ranking of Top 10 Software Development Companies-Infographics.
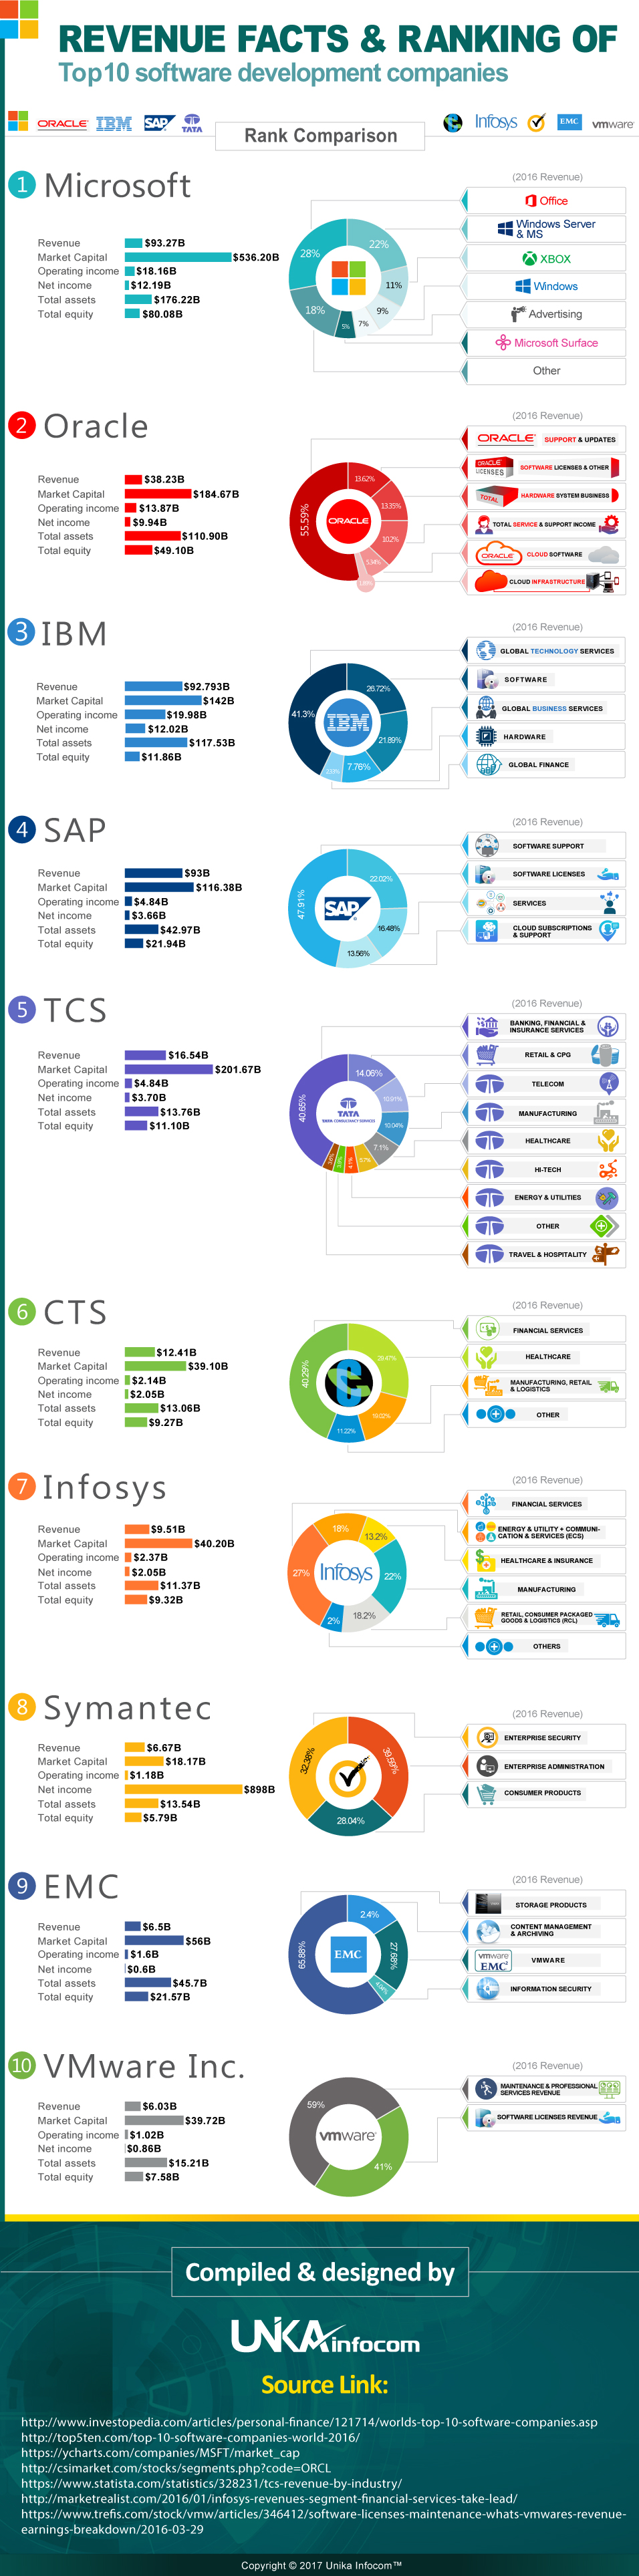
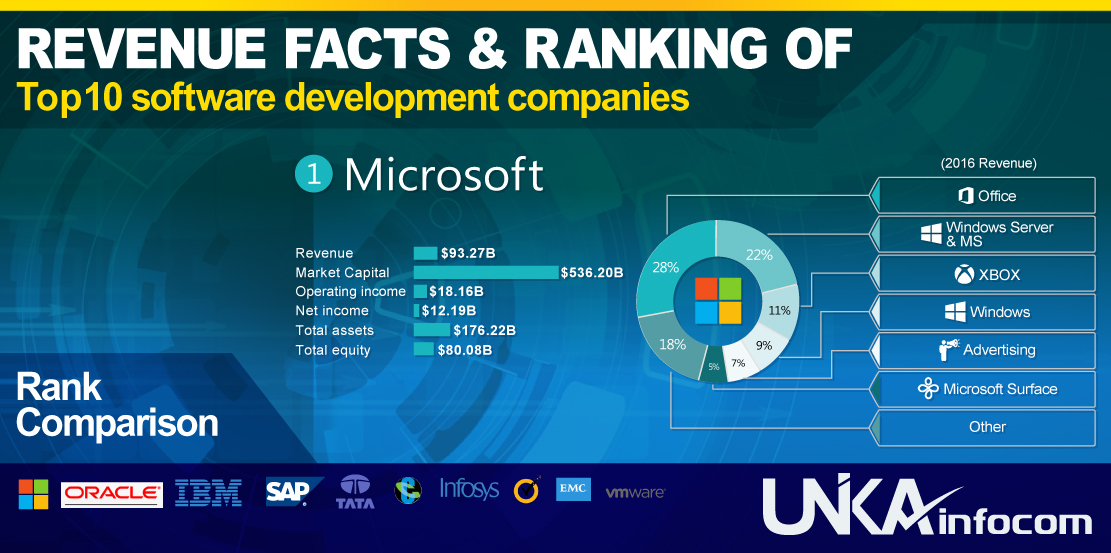
1. Microsoft:
Revenue : US$ 93.27 billion Market Capital: US$ 536.20 billion
Operating income : US$ 18.16 billion
Net income : US$ 12.19 billion
Total assets : US$ 176.22 billion
Total equity : US$ 80.08 billion
Percentage of Business Segments of Total Revenue:
| Business Segment | Percentage |
| Office | 28% |
| Windows Server & MS | 22% |
| XBOX | 11% |
| Windows | 9% |
| Advertising | 7% |
| Microsoft Surface | 5% |
| Other | 18% |
2. Oracle:
Revenue : US$ 38.23 billion Market Capital: US$ 184.67 billion
Operating income : US$ 13.87 billion
Net income : US$ 9.94 billion
Total assets : US$ 110.90 billion
Total equity : US$ 49.10 billion
Percentage of Business Segments of Total Revenue:
| Business Segment | Percentage |
| Software Licenses & Other | 13.62% |
| Updates & Product Support | 55.59% |
| Total Hardware System Business | 13.35% |
| Total Service & Support Income | 10.2% |
| Cloud Infrastructure | 1.89% |
| Cloud Software | 5.34% |
3. IBM:
Revenue : US$ 92.793 billion Market Capital: US$ 142 billion
Operating income : US$ 19.98 billion
Net income : US$ 12.02 billion
Total assets : US$ 117.53 billion
Total equity : US$ 11.86 billion
Percentage of Business Segments of Total Revenue:
| Business Segment | Percentage |
| Global Technology Services | 41.3% |
| Global Business Services | 21.89% |
| Hardware | 7.76% |
| Software | 26.72% |
| Global Finance | 2.33% |
4. SAP:
Revenue : US$ 19 billion Market Capital: US$ 116.38 billion
Operating income : US$ 4.84 billion
Net income : US$ 3.66 billion
Total assets : US$ 42.97 billion
Total equity : US$ 21.94 billion
Percentage of Business Segments of Total Revenue:
| Business Segment | Percentage |
| Software Support | 47.91% |
| Software Licenses | 22.02% |
| Services | 16.48% |
| Cloud Subscriptions & Support | 13.56% |
5. TCS:
Revenue : US$ 16.54 billion Market Capital: US$ 201.67 billion
Operating income : US$ 4.38 billion
Net income : US$ 3.70 billion
Total assets : US$ 13.76 billion
Total equity : US$ 11.10 billion
Percentage of Business Segments of Total Revenue:
| Business Segment | Percentage |
| Banking, Financial & Insurance Services | 40.65% |
| Retail & CPG | 14.06% |
| Telecom | 10.91% |
| Manufacturing | 10.04% |
| Healthcare | 7.1% |
| Hi-Tech | 5.7% |
| Energy & Utilities | 4.1% |
| Other | 3.9% |
| Travel & Hospitality | 3.6% |
6. CTS:
Revenue : US$ 12.41 billion Market Capital: US$ 39.10 billion
Operating income : US$ 2.14 billion
Net income : US$ 2.05 billion
Total assets : US$ 13.06 billion
Total equity : US$ 9.27 billion
Percentage of Business Segments of Total Revenue:
| Business Segment | Percentage |
| Financial Services | 40.29% |
| Healthcare | 29.47% |
| Manufacturing, Retail, Logistics | 19.02% |
| Other | 11.22% |
7. Infosys:
Revenue : US$ 9.51 billion Market Capital: US$ 40.20 billion
Operating income : US$ 2.37 billion
Net income : US$ 2.05 billion
Total assets : US$ 11.37 billion
Total equity : US$ 9.32 billion
Percentage of Business Segments of Total Revenue:
| Business Segment | Percentage |
| Financial Services | 27% |
| Energy & Utility + Communication & Services (ECS) | 18% |
| Healthcare & Insurance | 13.2% |
| Manufacturing | 22% |
| Retail, Consumer Packaged Goods & Logistics (RCL) | 18.2% |
| Others | 2% |
8. Symantec:
Revenue : US$ 6.67 billion Market Capital: US$ 18.17 billion
Operating income : US$ 1.18 billion
Net income : US$ 898 million
Total assets : US$ 13.54 billion
Total equity : US$ 5.79 billion
Percentage of Business Segments of Total Revenue:
| Business Segment | Percentage |
| Enterprise Security | 32.38% |
| Enterprise Administration | 39.59% |
| Consumer Products | 28.04% |
9. EMC:
EMC owns 80% VMware.
Revenue : US$ 6.5 billion Market Capital: US$ 56 billion
Operating income : US$ 1.6 billion
Net income : US$ 0.6 billion
Total assets : US$ 45.7 billion
Total equity : US$ 21.57 billion
Percentage of Business Segments of Total Revenue:
| Business Segment | Percentage |
| Storage Products | 65.88% |
| Content Management & Archiving | 2.4% |
| VMware | 27.68% |
| Information Security | 4.04% |
10. VMware Inc.:
Revenue : US$ 6.03 billion Market Capital: US$ 39.72 billion
Operating income : US$ 1.02 billion
Net income : US$ 0.86 billion
Total assets : US$ 15.21 billion
Total equity : US$ 7.58 billion
Percentage of Business Segments of Total Revenue:
| Business Segment | Percentage |
| Maintenance & Professional Services Revenue | 59% |
| Software Licenses Revenue | 41% |
Very useful information
Useful Information